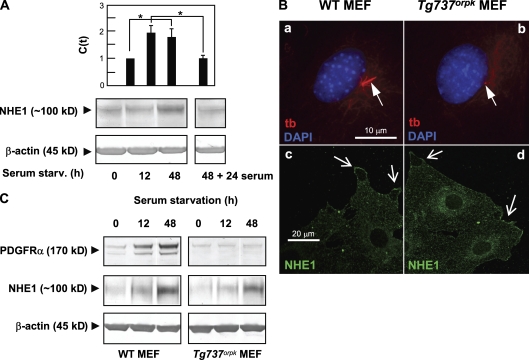
Figure 1.
Expression and localization of NHE1. (A) Quantitative data from real-time PCR analysis (top) and Western blotting (bottom) show up-regulation of both mRNA and protein levels of NHE1 during growth arrest in NIH3T3 cells exposed to serum starvation for 0 (interphase cells), 12, and 48 h. The up-regulation was reversible, as levels of both mRNA and protein were reduced to interphase levels after the readdition of serum for 24 h. The data shown represent 3–11 independent experiments for each condition. Error bars represent the SEM value of the relative C(t) value from each condition (n = 3–5). Data were analyzed using parametric or nonparametric ANOVA, and the level of significance is shown (*, P < 0.05). C(t), threshold cycle. (B, a and b) Epifluorescence microscopy analysis of primary cilia (red; anti–acetylated α-tubulin [tb]; arrows) in growth-arrested WT and Tg737orpk MEFs (serum starved for 48 h). (c and d) Confocal imaging of NHE1 localization (green) in growth-arrested WT (c) and Tg737orpk (d) MEFs. Arrows indicate lamellipodial regions of cells. Note that intracellular NHE1 localization is also seen. (C) Western blot analysis (n = 3) of PDGFR-α and NHE1 protein levels in WT and Tg737orpk MEFs after 0, 12, and 48 h of serum starvation. β-Actin was used as a loading control. As seen, growth arrest leads to up-regulation of both PDGFR-α and NHE1 protein levels in both WT and Tg737orpk MEFs.

