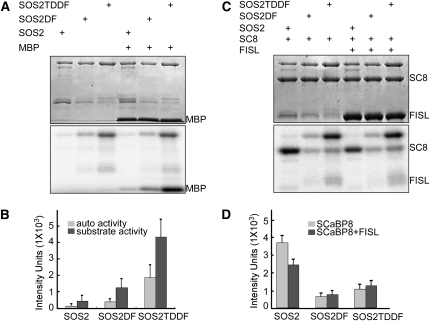
Figure 2.
SOS2–SCaBP8 Interaction Enhances SCaBP8 Phosphorylation.
(A) Highest levels of autophosphorylation and MBP phosphorylation are seen with SOS2T/DDF. SDS-PAGE with Coomassie blue–stained MBP and SOS2 proteins (top panel); autoradiograph showing SOS2 autophosphorylation (bottom panel, top bands) and MBP (bottom panel, bottom bands) phosphorylation.
(B) Quantification of data shown in (A). The signals were quantified by ImageQuant 5.0 software.
(C) Addition of exogenous FISL motif peptide reduces SOS2 phosphorylation of SCaBP8. SDS-PAGE with Coomassie blue–stained SCaBP8, FISL-GST, and SOS2 proteins (top panel); autoradiograph showing SOS2 autophosphorylation (bottom panel, top bands) and SCaBP8 phosphorylation (bottom panel, bottom bands).
(D) Quantification of data shown in (C). The signals were quantified by ImageQuant 5.0 software.
All data represent means ± se of at least three replicate experiments. Auto, SOS2 autophosphorylation; substrate activity, MBP phosphorylation; SOS2DF, SOS2 protein with the FISL motif deleted; SOS2T/DDF, SOS2 protein with the FISL motif deleted and a Thr-to-Asp mutation in the kinase domain.

