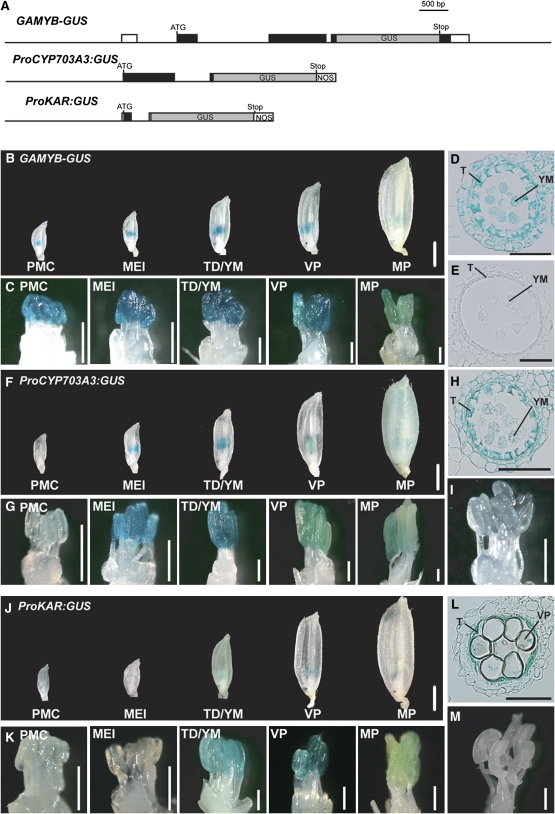
Figure 7.
GUS Expression under the Control of the Promoters of GAMYB, CYP703A3, and KAR during Anther Development.
(A) Schematic representation of the GAMYB-GUS, ProCYP703A3:GUS, and ProKAR:GUS constructs. Untranscribed regions and introns are shown as thin lines, untranslated regions as open boxes, and coding regions as closed boxes. GUS reporter regions are indicated in gray boxes. ATG, ATG start codon; Stop, stop codon; NOS, nos terminator.
(B) to (D) GUS expression of GAMYB-GUS (line #5) in the wild type. We analyzed 13 T0-independent lines.
(B) Whole flowers at each developmental stage. Bar = 1 mm.
(C) Close-up view of stamens. Bars = 400 μm.
(D) Cross section of anther at the TD/YM stage. Bar = 50 μm.
(E) Anther cross section of a transgenic line at the TD/YM stage carrying the vector control. Bar = 50 μm.
(F) to (H) GUS expression of ProCYP703A3:GUS in the wild type (line #4). We analyzed 10 T0-independent lines.
(F) Whole flowers at each developmental stage. Bar = 1 mm.
(G) Close-up view of stamens. Bars = 400 μm.
(H) Cross section of an anther at the TD/YM stage. Bar = 50 μm.
(I) GUS expression of ProCYP703A3:GUS in gamyb-2 (line #3). Bar = 400 μm. We analyzed 12 T0-independent lines.
(J) to (L) GUS expression of ProKAR:GUS in the wild type (line #7). We analyzed 10 T0-independent lines.
(J) Whole flowers at each developmental stage. Bar = 1 mm.
(K) Close-up view of stamens. Bars = 400 μm.
(L) Cross section of an anther at the VP stage. Bar = 50 μm.
(M) GUS expression of ProKAR:GUS in gamyb-2 (line #2). We analyzed 13 T0-independent lines. Bar = 400 μm. T, tapetal layer; YM, young microspore; VP, vacuolated pollen.

