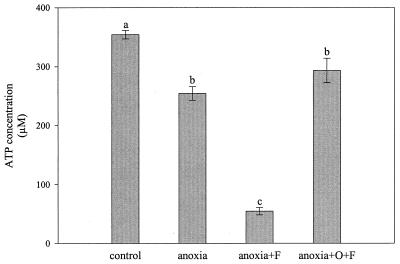
Figure 1.
ATP concentration of frog skeletal muscle mitochondrial suspensions in normoxia and after 30 min of anoxia. The experimental conditions are described in Materials and Methods. “Control” represents mitochondria respiring under state 4 conditions. O, oligomycin; F, FCCP (uncoupler). Data are means ± SEM. n = 6 for “control” and “anoxia”; n = 5 for “anoxia + F” and “anoxia + O + F”. Statistical differences between experimental conditions are represented by different letters (P < 0.05; one way ANOVA and a posteriori test of Tukey).

