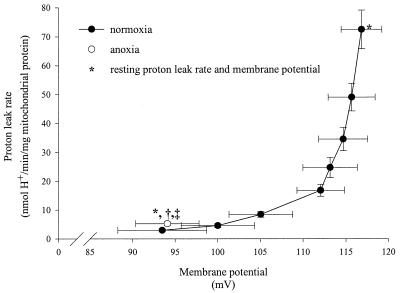
Figure 2.
Kinetics of frog skeletal muscle mitochondrial proton leak in normoxia and in anoxia. The experimental conditions are described in Materials and Methods. In normoxia, the membrane potential is generated by the electron transport chain; however, in anoxia, the electron transport chain is inhibited, and the ATP synthase functions as an ATPase, pumping protons from the matrix to the cytosol to preserve a certain membrane potential. The normoxic and anoxic conditions are represented by black and white circles, respectively. Data are means ± SEM; n = 6 for normoxia and anoxia. *, Resting proton leak rate and membrane potential. †, Significant difference from the resting proton leak rate in normoxia (P < 0.05; Student's t test). ‡, Significant difference from the resting membrane potential in normoxia (P < 0.05; Student's t test).

