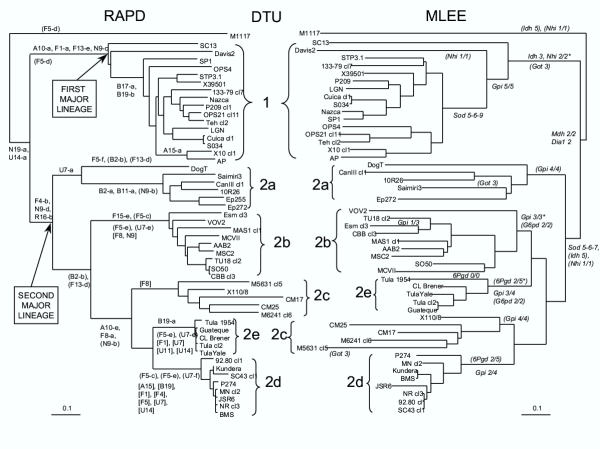
Figure 1.
Neighbour joining dendrograms based on the analysis of 20 RAPD* primers (left) and 22 isoenzymatic* loci (right) showing the genetic relationships between 49 Trypanosoma cruzi stocks and T. cruzi marinkellei stock M1117. The scale indicates the Jaccard distance [39] along the branches. Six genetic clusters, or Discrete Typing Units (DTUs [14]), were distinguished and their names are given in the central column between the dendrograms. DTU 1 corresponds to the 1rst major lineage of T. cruzi, while the second major lineage is subdivided into DTUs 2a to e. Diagnostic RAPD fragments and isoenzymatic patterns, which were specifically observed in the stocks of a given cluster of the dendrograms (tags [14]), are indicated at the corresponding nodes (after [17]).

