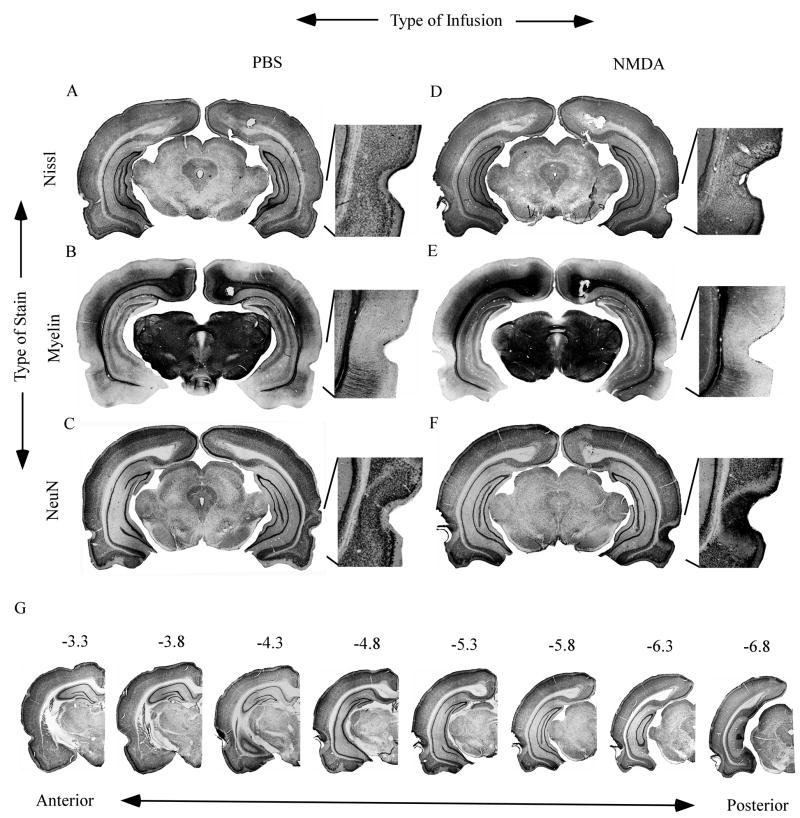
Figure 2.
Coronal sections from an animal in the sham-operated control group (PBS; Panels A through C) and an animal in the neurotoxic-lesioned group (NMDA; Panels D through G). Panels A and D are Nissl-stained sections; panels B and E are myelin-stained sections; and panels C and F are NeuN-stained sections. Panel G shows unilateral NeuN-stained sections taken at eight different anterior-posterior locations (from −3.3 to −6.8 mm relative to Bregma).

