
Figure 3.
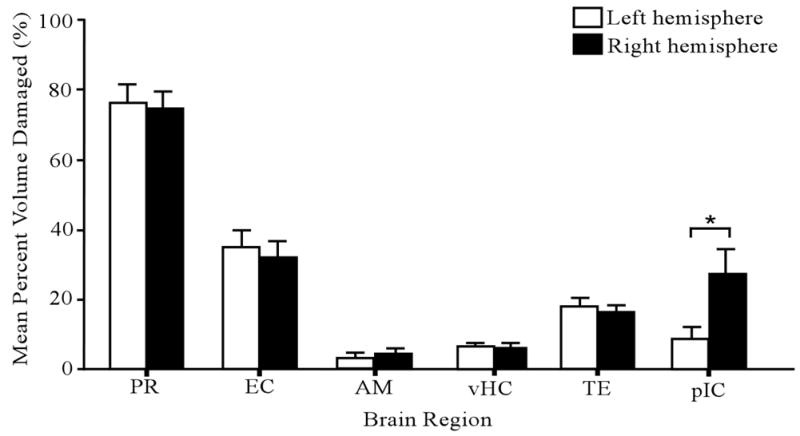
Amount of neurotoxic damage in six different brain regions. The open and filled bars represent the left and right hemispheres, respectively. The asterisk denotes a significant difference between left and right hemispheres in the mean amount of damage. Error bars represent ± 1 SE. Abbreviations: PR, perirhinal cortex; EC, entorhinal cortex; AM, amygdala; vHC, ventral hippocampus; TE, temporal cortex; and pIC; posterior insular cortex.