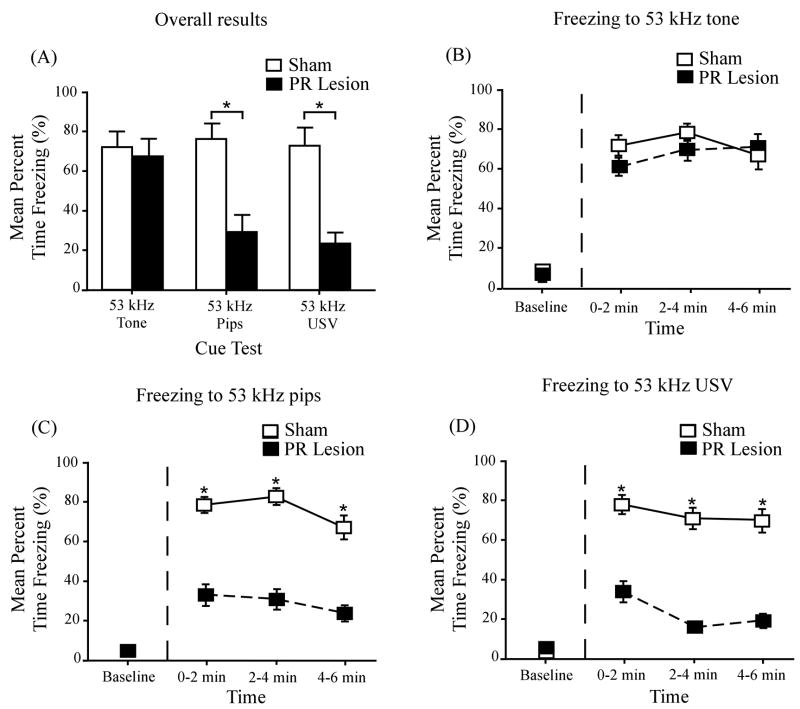
Figure 4.
Effects of perirhinal lesions on conditional freezing in response to each of the three auditory cues. (A) Mean percent freezing to the 53 kHz tone, the 53 kHz discontinuous tone (tone pips), and the 53 kHz USV during cue testing in a shifted context. The open and filled bars represent, respectively, mean freezing levels in the sham-operated control group and the neurotoxic-lesioned group. Asterisks denote significant group differences. (B) Time course of freezing, in response to the continuous tone, in the sham-operated control group (open squares) and the lesioned group (filled squares). There were no significant group differences before or during the presentation of the cue. (C) Time course of freezing, in response to the discontinuous tone (pips), in the sham-operated control group (open squares) and the lesioned group (filled squares). There were significant group differences in all three time periods after the cue presentation, but no significant differences during the baseline period. (D) Time course of freezing, in response to the USV, in the sham-operated group (open squares) and the lesioned group (filled squares). There were significant differences in all three time periods after the cue presentation, but no significant differences during the baseline period. Error bars represent ± 1 SE.

