
Figure 1.
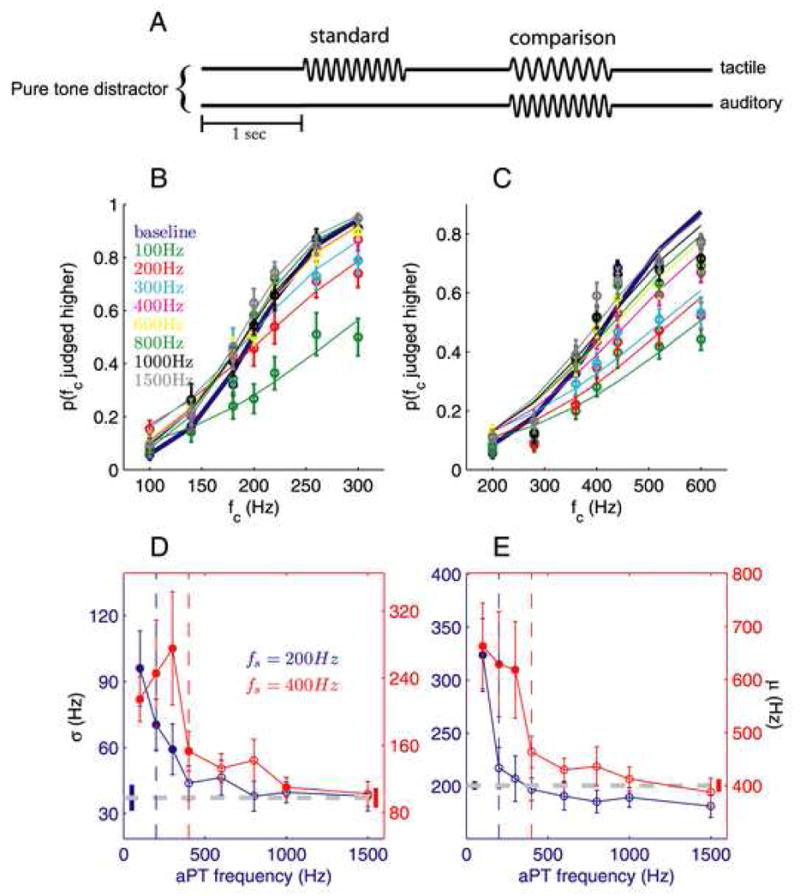
Tactile frequency discrimination in the presence of auditory pure tone (aPT) distractors (14 and 20 subjects for the 200-Hz and 400-Hz standards, respectively). (A) Experimental design. (B,C) Proportions of trials the comparison was judged higher in frequency, averaged across all participants, as a function of the comparison frequency fc, tested with the 200- (B) and 400-Hz (C) standards. Each colored trace corresponds to a different aPT distractor (blue denotes baseline performance). Error bars indicate s.e.m. (D) Mean sensitivity (σ) as a function of distractor frequency (filled points indicate means that are significantly different from baseline). The gray dashed line and untethered bars correspond to baseline and s.e.m, respectively. The blue and red vertical dashed lines correspond to the frequency of the standards (200- and 400-Hz respectively). With the 200-Hz standard (blue trace), aPT distractors ranging from 100 to 300Hz significantly reduced sensitivity (i.e. yielded a larger σ) (t(13) = 4.3, P = 0.0009, t(13) = 4.0, P = 0.002, and t(13) = 3.35, P = 0.005, respectively). With the 400-Hz standard (red trace), the 100-, 200-, 300-, 400-, and 1000-Hz aPT distractors significantly decreased sensitivity (t(17) = 4.5, P = 0.0003, t(17) = 3.8, P = 0.001, t(18) = 3.8, P = 0.001, t(18) = 2.9, P = 0.009, and t(19) = 3.0, P = 0.008, respectively). (E) Mean bias (μ) as a function of distractor frequency (conventions as in (D)). With the 200-Hz standard, only the 100-Hz aPT significantly biased perceived tactile frequency (t(13) = 3.58, P = 0.003). With the 400-Hz standard, aPT distractors ranging from 100 to 300Hz significantly biased perceived tactile frequency (t(17) = 4.6, P = 0.0003, t(17) = 3.7, P = 0.002, and t(18) = 3.0, P = 0.007).