
Figure 3.
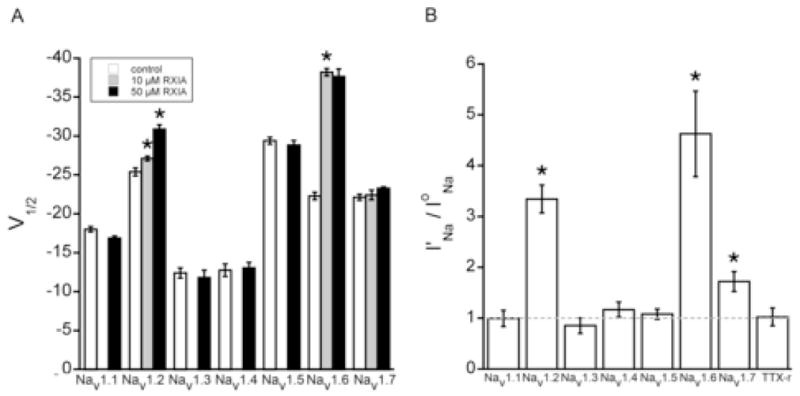
Effect of ι-RXIA on NaV1.1 through NaV1.7 coexpressed with β1 in Xenopus oocytes and TTX-resistant Na channels in dissociated neurons from mouse DRG. Oocytes were used as in Fig. 2, and neurons were whole-cell clamped and TTX-resistant INa were recorded as described in Methods. A, V1/2 of the voltage-dependence of activation in controls (white bars) and in the presence of 10 μM (gray bars) or 50 μM (black bars) ι-RXIA. In 10 μM ι-RXIA, V1/2‘s of only NaV1.2/β1 and 1.6/β1 differed significantly from control. In 50 μM ι-RXIA, V1/2 of NaV1.6/β1 remained unchanged, that of NaV1.2/β1 changed further, and those of NaV1.1/β1, 1.3/β1, 1.4/β1, 1.5/β1, and 1.7/β1 remained insignificantly different from controls. B, Ratio of I′Na/IoNa for Vstep to −30 mV, where I′Na and IoNa are peak INa in 50 μM ι-RXIA and control, respectively. The ratio measurement shows that in addition to NaV1.2/β1 and 1.6/β1, NaV1.7/β1 was also significantly up-modulated by 50 μM ι-RXIA. I′Na/IoNa value of none of the other Na channels differed significantly from 1, indicating they were not affected even at this high toxin concentration. Bars represent mean ± SE (N = 3). *p < .05, compared to bar immediately to its left (A) or compared to value of 1 (B).