
Figure 4.
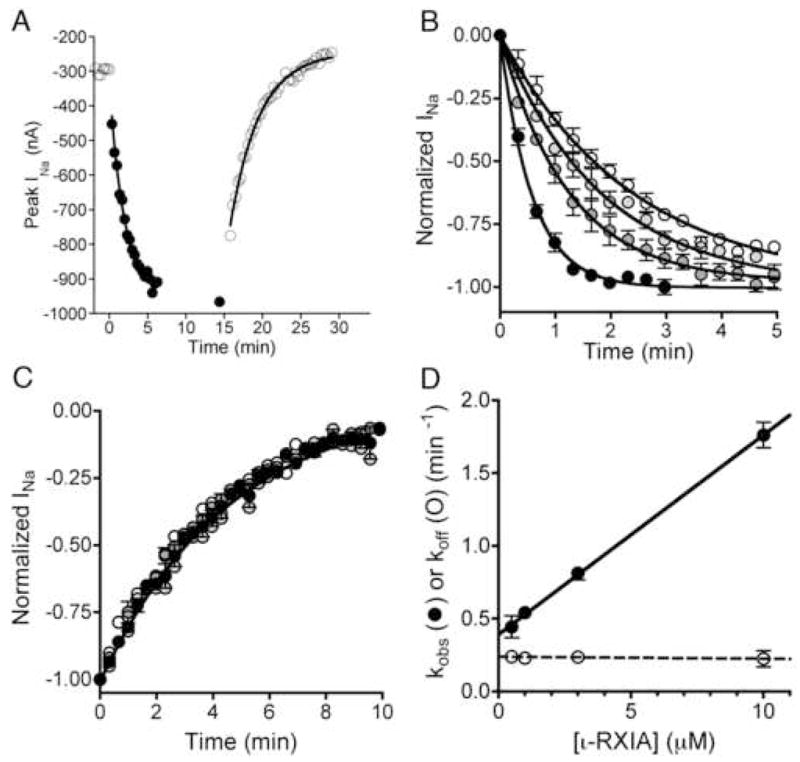
Kinetics of the modulation of NaV1.6/β1 by ι-RXIA. Oocytes were used essentially as described in Fig. 2, and the peak INa in response to a Vstep to −30 mV from a holding potential of −100 mV was measured at different times during the exposure to and washout of ι-RXIA. A, Representative time course of INa during exposure to 3 μM ι-RXIA (closed circles) and its subsequent washout (open circles). Absence of points for 5 min in middle of plot reflects period when I-V data were being acquired. Single-exponential best-fits of the data provided kobs (the observed rate constant for the toxin-induced increase in INa) and koff (the rate constant of recovery following washout). Values of kobs and koff for illustrated curves were 0.65 min−1 and 0.24 min−1, respectively. B, Time course of normalized peak INa upon exposure to 0.5, 1, 3, and 10 μM ι-RXIA (from white to progressively darker circles, respectively). C, Time course of normalized peak INa following washout of ι-RXIA (symbols as in B). The data points largely overlap, and the best fit single-exponential curve for all of them is shown, yielding an aggregate koff of 0.227 ± 0.007. D, Plot of kobs (closed circles) and koff (open circles) versus [ι-RXIA], from data shown in B and C, respectively. Values for kobs increased linearly with peptide concentration, best-fit linear regression line (solid curve) has slope of 0.137 ± 0.002 μM−1•min−1 and Y-intercept of 0.394 ± 0.011 min−1. In contrast, koff values remained invariant, with average value of 0.229 ± 0.021 min−1. Each data point represents mean ± S.E. (N = 3 oocytes).