
Figure 7.
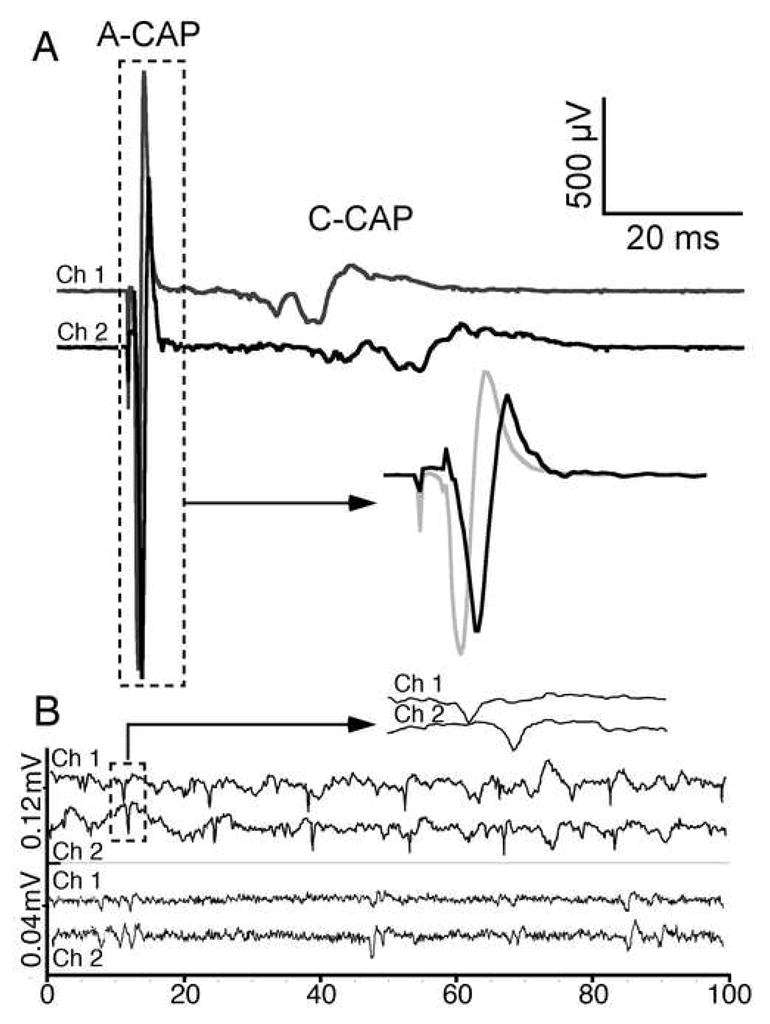
ι-RXIA induces action potentials in A- and C-fibers in mouse sciatic nerve. Extracellular action potentials were recorded simultaneously from two locations along the nerve as described in Methods, 7 mm apart. In each pair of traces, the upper (Channel 1) and lower (Channel 2) traces were recorded from a proximal versus distal location, respectively, relative to the site of electrical stimulus (A) or toxin-application (B). A, Stimulus-evoked compound action potentials (CAPs) in control solution showing fast A-CAP with conduction velocity of 11.8 m/s, and slower C-CAP with conduction velocity in the range of 0.72 to 0.48 m/s. Region of A-CAPs enclosed by (10 ms wide) dashed box is shown in inset with baselines superimposed and reveals a ~ 0.6 ms temporal offset; note 1 ms stimulus artifact near start of traces. B, “Spontaneous” action potentials induced by exposure to 0.05 μM ι-RXIA; representative recordings of single-units with conduction velocities of about 10 (top pair) and 0.7 (bottom pair) m/s. Region of top pair of traces enclosed by (5 ms wide) dashed box is shown in inset, revealing a ~ 0.7 ms temporal offset of this unit corresponding to that of an A-fiber. Lower trace in bottom pair of traces has been shifted leftward by 9.5 ms and reveals near coincidence of units corresponding to those of C-fibers.