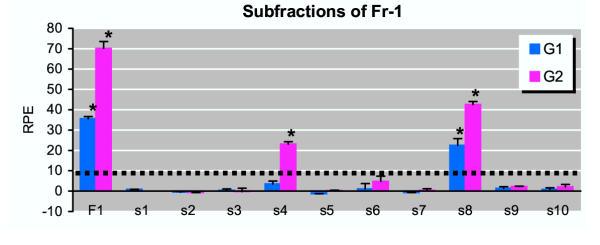
Figure 4.
Biomarker analysis of subfractions of Fraction-1 from pregnant women. Duplicate serum samples from two pregnant women (G1 and G2) from the control group were separated on HPLC, and Fr-1 (0–5.5 minutes) was collected in ten subfractions (each 0.5 minutes), indicated as s1 to s10 on the figure. The subfractions from one of the duplicate samples from each woman were pooled after HPLC separation, as a positive control of the complete Fr-1. After reconstitution, the samples were analyzed by E-Screen. Results are expressed as the relative proliferative effect (RPE) to E2. Values shown are mean ± SD from triplicate wells. The broken line represents the background of the experiment (the mean of negative controls + 3x SD). Asterisk (*) indicate significant difference (P < 0.05) from background.

