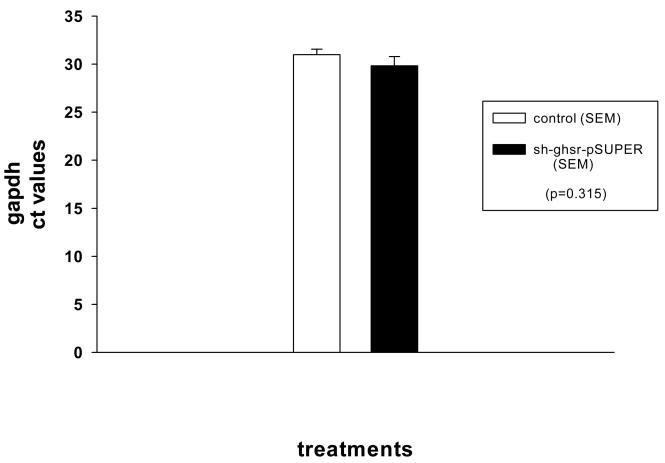
Figure A. Real time PCR gapdh CT values in PVN samples from control and sh-ghsr-pSUPER groups.
gapdh CT values in PVN samples run in duplicates from each group were statistically analyzed using the one-way ANOVA. Data is expressed as mean with ±SEM. White bar represents control group whereas black bar sh-ghsr-pSUPER group, p=0.315.

