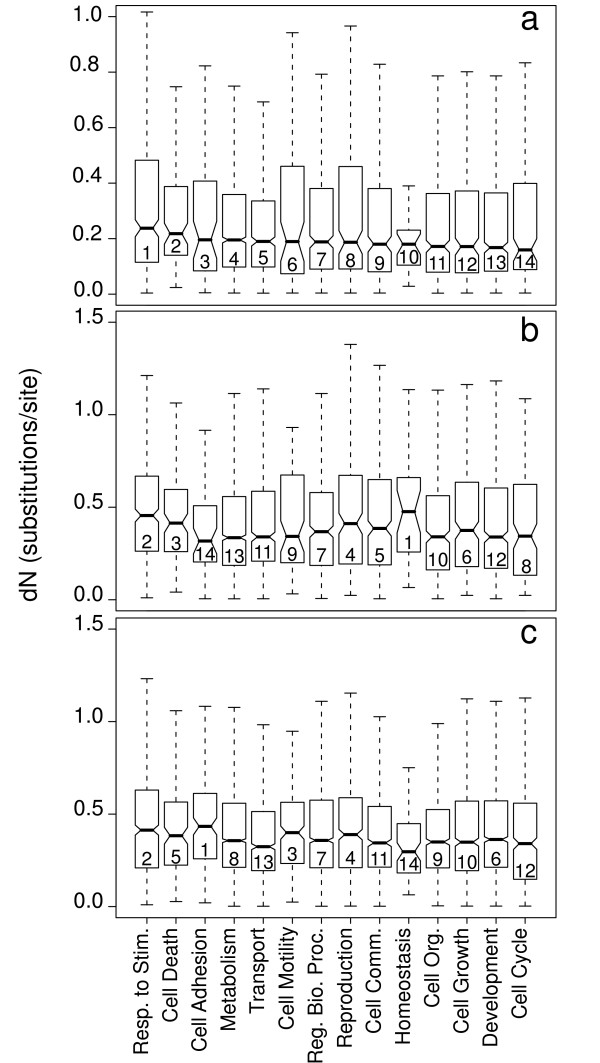
Figure 3.
Box plots of the distributions of non-synonymous substitution rate (dN) values in each GO category. The pairwise comparisons are: S. crassipalpis to D. melanogaster (a), S. crassipalpis to A. gambiae (b), and A. gambiae to D. melanogaster (c). The upper and lower bounds of the notches represent the 95% confidence interval of the median, and the numbers inside the boxes represent the relative rank within each pairwise comparison.

