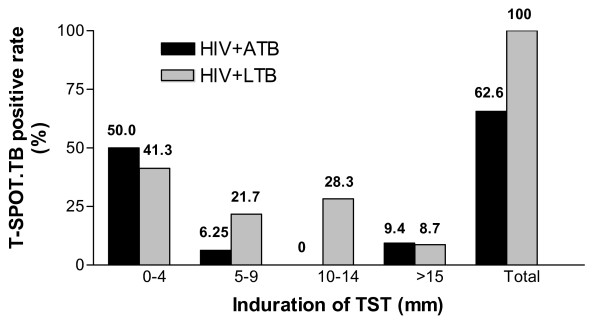
Figure 2.
T-SPOT.TB positive rate in group HIV+ATB and HIV+LTB stratified by indurations of TST (mm). The black column represents the T-SPOT.TB positive rate of patients in HIV+ATB group, and the gray column represents the T-SPOT.TB positive rate of patients in HIV+LTB group. The T-SPOT.TB positive portion with TST 0–4 mm was misdiagnosed by TST.

