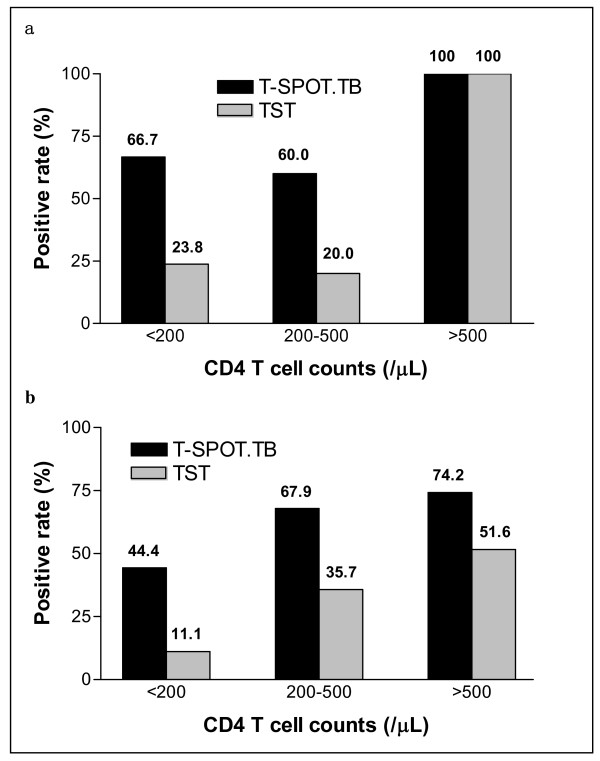
Figure 4.
Positive rates of HIV+ individuals to ESAT-6/CFP-10 T-SPOT.TB and to TST, by CD4+ T cell count. The black column represents the T-SPOT.TB positive rate, and the gray column represents TST positive rate. (a) Patients with active TB (group HIV+ATB). In subgroups of CD4+ T cells <200/μl and 200–500/μl, both P < 0.0001; (b) Individuals without active TB evidence (group HIV+LTB and HIV only). In subgroups of CD4+ T cells <200/μl and 200–500/μl, both P < 0.0001.

