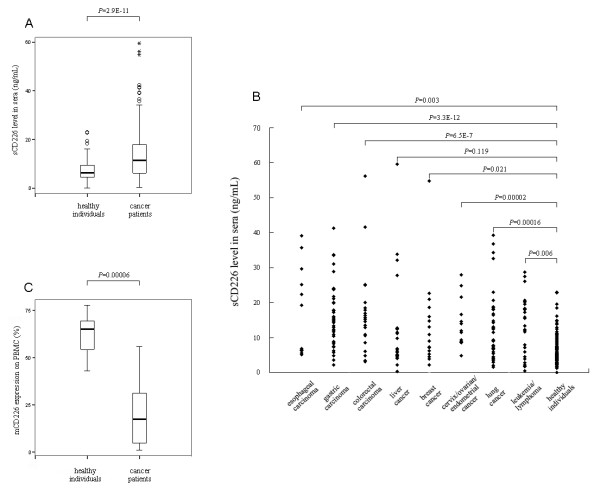
Figure 1.
Sera sCD226 level and PBMC mCD226 expression of cancer patients and normal subjects. (A) Comparison of sCD226 levels in sera of cancer patients and healthy individuals. Plots (generated using SPSS) show the range of data values obtained. Two hundred and fifty-nine cancer patients (135 male and 124 female, ages 25–65 y) were compared with 129 healthy individuals (69 male and 60 female, ages 25–65 y). (B) Comparison of sCD226 levels in sera of individual patient groups and control group. Data of 49 patients with other kinds of tumors are not shown here due to the large number of tumor types and small sample number of each type. (C) Comparison of positive percentage of mCD226 on PBMC from cancer patients (10 male and 4 female, ages 25–45 y) and healthy individuals (8 male and 4 female, ages 25–40 y). Top and bottom whiskers, values of the top and bottom 25% of the cases, respectively; boxed area, inter-quartile range and the significant P values between groups; horizontal black line, median value; stars and circles, extreme and outlying values, respectively (as defined by SPSS).

