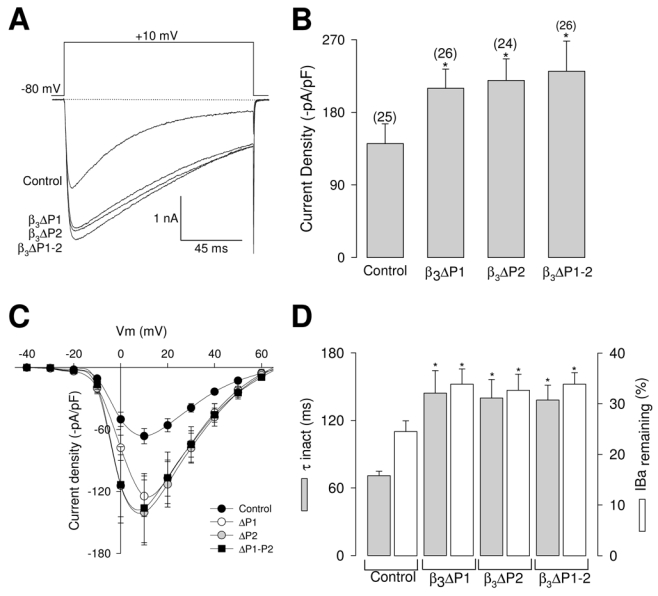
Fig. 4.

Deletion of the PEST-like sequences alters whole-cell IBa in HEK-293 cells. A, superimposed representative IBa recordings obtained from HEK-293 cells co-expressing neuronal recombinant CaV2.2/α2δ-1 channels and the wild-type CaVβ3 subunit (control) or its PEST deletion mutants (ΔP1, ΔP2 and ΔP1–2) in response to 140 ms test pulses to +10 mV from the holding potential of −80 mV. B, Comparison of peak IBa densities in CaV2.2/α2δ-1 channels coexpressed with wild-type CaVβ3 or the PEST deficient mutants. Data are expressed as mean ± S.E., and the number of recorded cells is indicated in parentheses. Statistical significance was determined by Student’s t-test (*, P<0.05). C, IBa density-voltage relationship averages for HEK- 293 cells co-expressing neuronal recombinant CaV2.2/α2δ-1 channels and the wild-type CaVβ3 subunit (control; filled circles, n = 6) or its single (ΔP1; open circles, n = 7; and ΔP2 gray circles, n = 6) and double PEST deletion mutants (ΔP1–2; filled squares, n = 7). Currents were elicited by eleven 140 ms depolarizing pulses between −40 and +60 mV in 10 mV increments from a holding potential of −80 mV. D, Comparison of inactivation time constants (τinact; gray bars) and percentage of inactivated channels at the end of a test pulse to +10 mV (open bars) for IBa through CaV2.2/α2δ-1 channels co-expressing the wild-type CaVβ3 subunit or its ΔPEST mutants. The time course of inactivation was typically best fit with a monoexponential function. Bars represent mean ± S.E. values of 25 cells in each condition. Statistically significant results are shown by the asterisk (t test; P<0.05).
