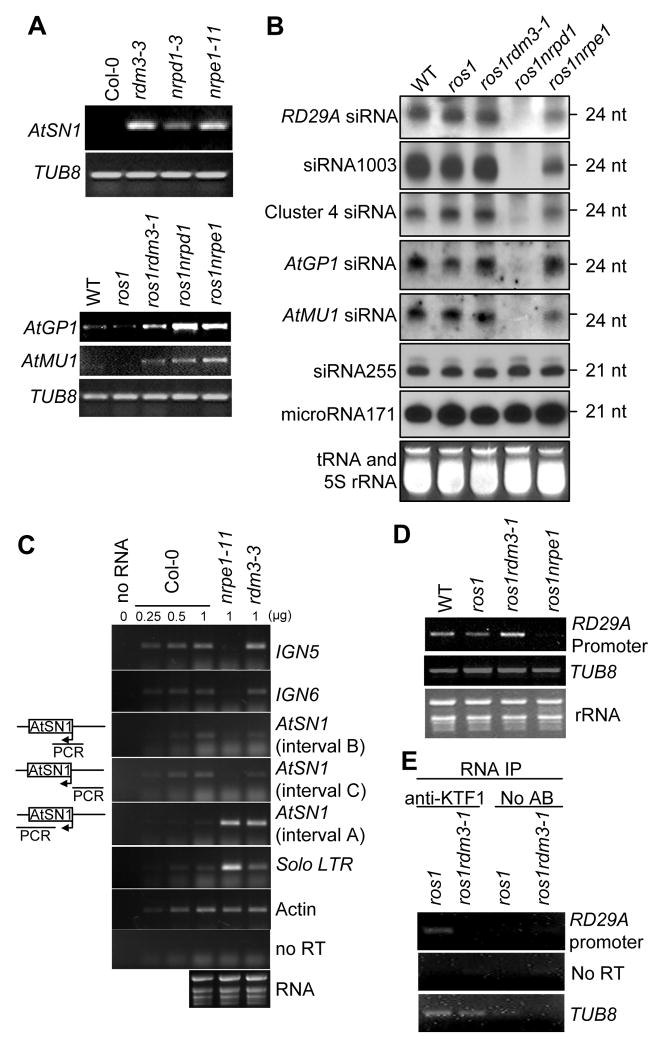
Figure 3. Effect of the rdm3 mutations on RNA and siRNA levels from the RdDM target loci.
(A) The rdm3 mutations increase the RNA expression levels of AtSN1, AtGP1, and AtMU1. Semi-quantitative RT-PCR was used to detect the transcript levels of AtSN1 (interval A, see diagram in panel C), AtGP1, and AtMU1 in the indicated genotypes. TUB8 was amplified as an internal control. (B) Small RNA blot analysis of 24-nt siRNAs, 21-nt ta-siRNAs, and microRNAs in the various genotypes. The positions of size markers (21 nt and 24 nt) are indicated. The ethidium bromide-stained small RNA gel is shown as a loading control. (C) Strand-specific RT-PCR analysis of IGN5, IGN6, AtSN1 and solo LTR transcripts in the Col-0 wild type, nrpe1-11 and rdm3-3. Actin PCR products and total RNA resolved by agarose gel electrophoresis serve as loading controls. Reactions without reverse transcriptase (no RT) were performed to control for background DNA contamination. The positions of the different AtSN1 intervals tested by RT-PCR are indicated in the diagram on the left. (D) RT-PCR analysis of RD29A promoter transcript. TUB8 and ethidium bromide-stained gel are shown as controls. (E) RT-PCR detection of RD29A promoter transcript in KTF1 immunoprecipitates. The background signal from TUB8 was used as an internal control, which indicated no difference between the RNA amounts from ros1 and ros1rdm3-1. No AB, controls without using anti-KTF1 antibody.

