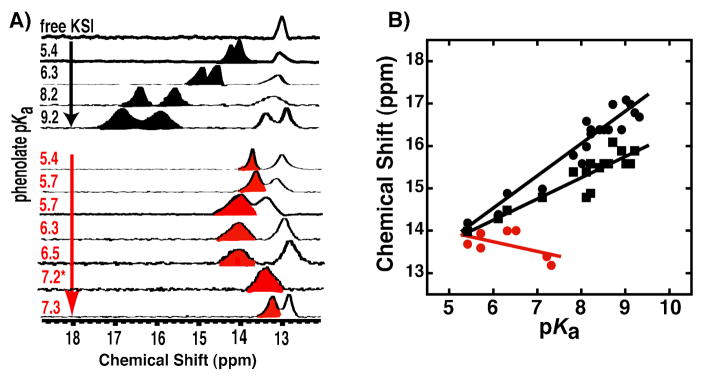
Figure 5.
1H NMR spectra of tKSID40N•phenolate complexes. (A) Downfield regions of spectra of non-ortho-substituted phenolates (black, from ref. 55), and DFPs (red) bound to KSI at pH 7.2. Note the spectrum for 2,4,6-F3-phenol (pKa 7.2) was acquired at pH 5.8 due to substantial overlap of the hydrogen-bonded peak with the 13 ppm enzymatic peak at pH 7.2 (see Figure S4). (B) Correlation between increasing phenolate pKa and chemical shift of the observed downfield hydrogen bonded proton peak(s). Black symbols represent the two black peaks observed in the non-ortho-substituted phenolate spectra in (A) (and additional spectra not shown; data from ref. 55), and red symbols represent the downfield peak observed in the DFP spectra in (A) (data from Table S3).

