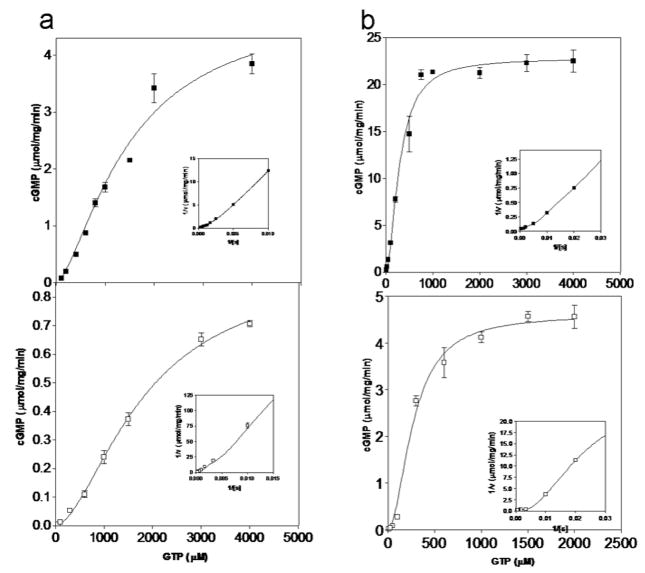
Figure 3.
Kinetic analysis of purified GCA deletion mutants. In vitro guanylyl cyclase assays were carried for GCAID (open squares) and GCACC+GC (closed squares) out with increasing concentrations of GTP in the presence of either 10mM MgCl2 (a) or 6mM MnCl2 (b). Average values of duplicate measurements are plotted along with standard deviations. Curves represent the fitting of data points to the Hill equation in an iterative manner using GraphPad Prism, that were used to determine kinetic parameters summarized in Table 1. Inset: Double reciprocal transformation of the data points obtained.

