
Figure 4.
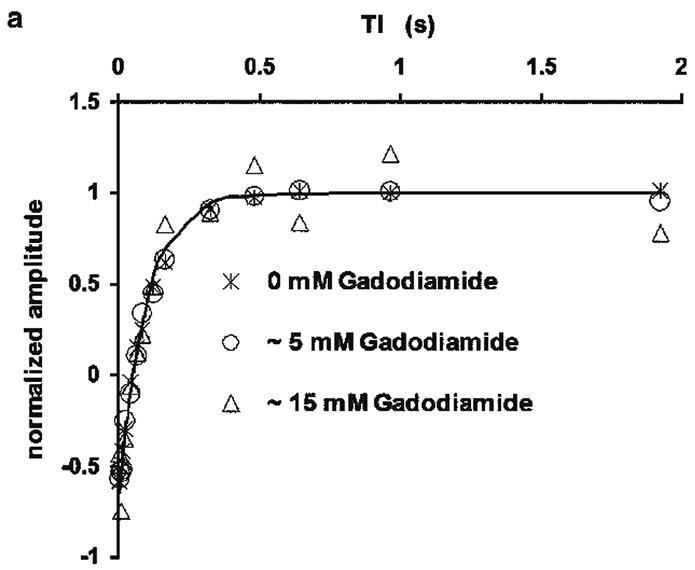
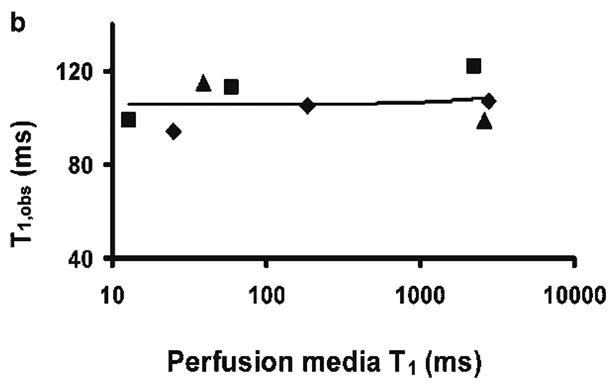
Figure 4a. Normalized inversion recovery curves from a typical batch of perfused HeLa cells with various Gadodiamide concentrations (crosses, 0 mM; circles, ~ 5 mM; triangles, ~ 15 mM) in the perfusing media. The line is the modeled curve assuming monoexponential magnetization recovery for the data set of 0 mM Gadodiamide. The modeled curves of the other two sets of data are overlapping with this line. Data acquired at inversion times longer than 2 s are not shown. As the concentration of gadodiamide increases, the linewidth of the observed water resonance is broadened from 20 Hz to 300 Hz, presumably due to inhomogeneous bulk susceptibility effects. The assessment of water 1H resonance amplitude at greater relaxation agent concentrations (shorter relaxation times) is increasingly uncertain.
Figure 4b. Exchange-modified longitudinal relaxation time measured from HeLa perfused cells on microbeads, T1,obs, vs. the inherent spin-lattice relaxation time of perfusion media at different concentrations of Gadodiamide. Note that the x-axis scale is logarithmic. Different symbols represent different batches of cells. A linear regression curve is plotted through the data and its slope is 0.001. Because the x-axis is in logarithmic scale, the fitted linear curve does not appear to be a straight line.