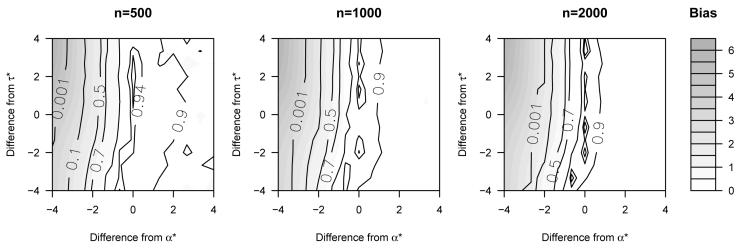
Figure 2.
Results of simulations with the 95% coverage indicated using contour lines and the absolute bias of the point estimates represented by shading. The figures are centered at the true values of the sensitivity parameters, denoted α* and τ*. The true SACE as a difference in expectations equals -10.4.

