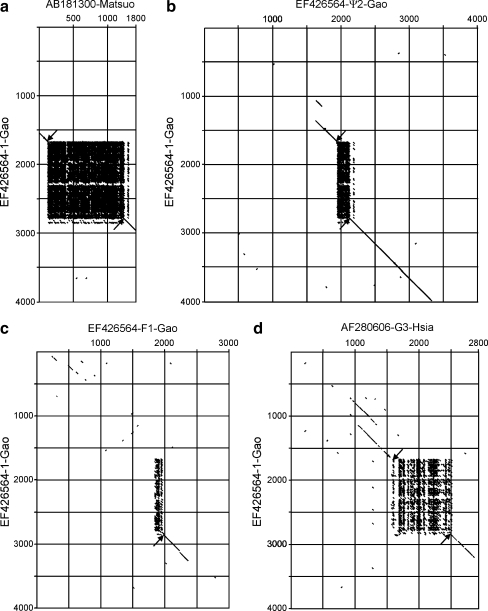
Fig. 2.
Comparing ω-gliadin sequences. Gene 1 from Fig. 1 is compared by dot plots to other ω-gliadin sequences to include coding and near flanking regions. a 1B ω-gliadin (AB181300) of Matsuo et al. (2005). b pseudogene Ψ2 of Fig. 1. c ω-Gliadin fragment F1 of Fig. 1. d ω-Gliadin F20b (AF280606) of Hsia and Anderson (2001). Matching criteria were 80% over a 20-base window. Down arrows indicate start codons and upward arrows indicate stop codons

