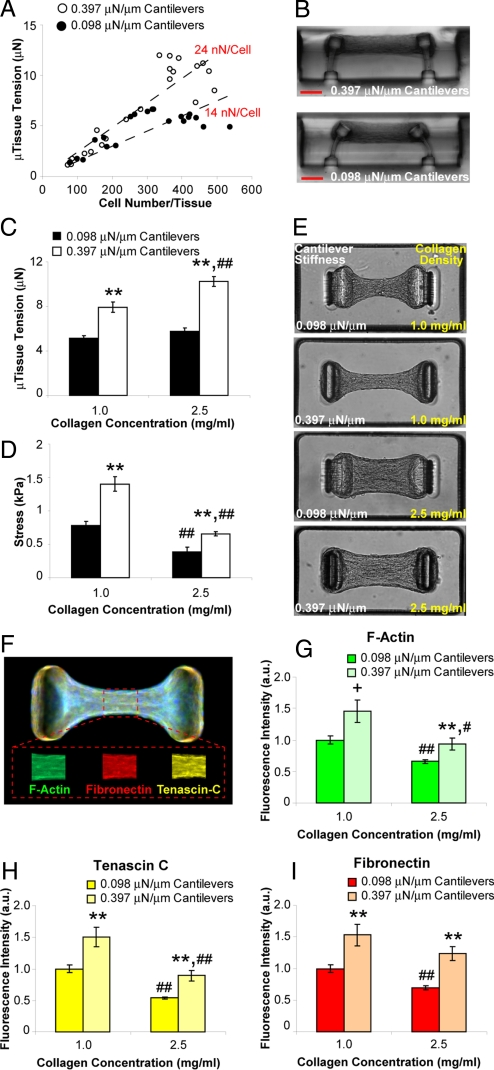
Fig. 2.
Boundary and matrix mechanics regulate cellular contractility and protein deposition. (A) Plot of microtissue tension vs. number of cells per tissue for constructs tethered to rigid (0.397 μN/μm, open circles) or flexible (0.098 μN/μm, closed circles) cantilevers. (B) Representative cross sections of microtissues tethered to rigid or flexible cantilevers. (C) Plot of average microtissue tension for tissues constructed from 1.0 mg/mL or 2.5 mg/mL collagen gels tethered to rigid or flexible cantilevers. (D) Plot of average midpoint stress for tissues constructed from 1.0 mg/mL or 2.5 mg/mL collagen tethered to rigid or flexible cantilevers. (E) Phase contrast images of microtissues in each of the 4 combinations of collagen density and cantilever stiffness. (F) Representative immunofluorescence overlay of cytoskeletal and ECM proteins within microtissues. Mean fluorophore intensity was measured over a 30-μm long segment at the tissue midsection using distinct fluorphores for each protein (Inset). (G–I) Plots of average relative fibrillar actin, fibronectin and tenascin C levels under each of the 4 combinations of collagen density and cantilever stiffness. Data from (C and D) are the average of 15 microtissues from each condition ± SEM. Data from (G–I) are the average of 40 microtissues for each condition ± SEM. **, P < 0.01; *, P < 0.05; +, P < 0.05 (Student's t test) P = 0.15 (MWU) for 0.397 vs. 0.098 μN/μm cantilevers; ##, P < 0.01; #, P < 0.05 for 2.5 vs. 1.0 mg/mL collagen. (Scale bar: 100 μm.)

