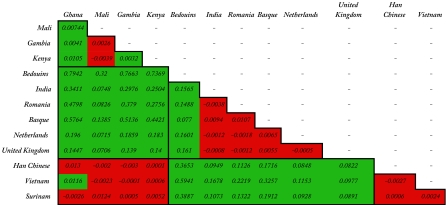
Table 3.
Population differentiation test outcomes
Outcomes are presented in red if there was no significant differences (P > 0.05) between the populations, meaning that the allelic compositions of the populations do not differ. Outcomes are presented in green if the allelic composition differed (P < 0.05 was considered to be significant). Numbers indicate the pairwise Fst values between populations. Squares indicate populations that came from the same continent.

