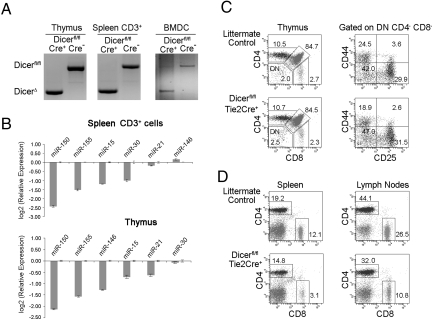
Fig. 1.
Ablation of dicer expression in hematopoietic stem cells. (A) PCR typing of genomic DNA isolated from thymocytes, CD3+ T cells, and bone marrow-derived dendritic cells (BMDC) of Dicerfl/flTie2cre+ and Dicerfl/flTie2cre− mice. The deletion Dicer allele produced a 471-bp PCR product whereas the WT allele resulted in a 1,300-bp product. (B) Micro RNA gene expressions in thymus and spleen CD3+ cells by Taqman real-time PCR. Results were the average measured in duplicate and normalized to a control gene (snoRNU 202). Error bars are SD. The expression of miRNAs in thymus and splenic T cells was significantly reduced in Dicerfl/flTie2cre+ mice compared to Dicerfl/flTie2cre− mice. (C) Flow cytometric analysis of thymocytes from Dicerfl/flTie2cre+ and Dicerfl/flTie2cre− littermates. Contour plots depict CD4 (y axis) versus CD8 (x axis) staining profiles in thymus cells (Left), CD44 (y axis) versus CD25 (x axis) staining profile in gated CD4−CD8− DN thymus cells (Right). (D) Flow cytometric analyses of spleen (Right) and lymph nodes (Left) from Dicerfl/flTie2cre+ and Dicerfl/flTie2cre− littermates. Percentages of cells in each quadrant are indicated. Data are representative of 3 independent experiments (2–3 mice per group).

