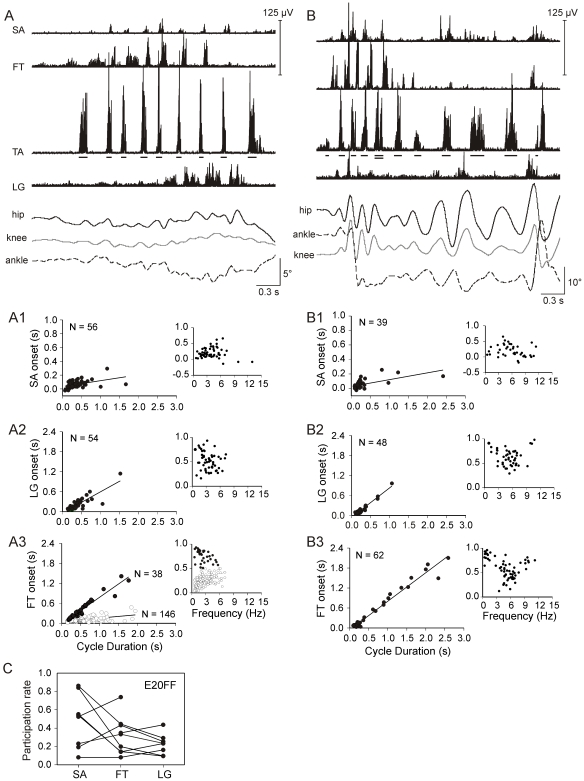
Figure 5. Control and foot-free RLMs during an E20 experiment.
A: A control RLM of 8 cycles is shown (4.0±1 Hz). B: A double horizontal line identifies the end of one foot-free RLM (6.8±0.7 Hz) and start of another much slower RLM (3.1±0.7 Hz). Note differences in kinematic scales and also the faster frequencies during foot-free RLMs. A1and B1: SA onset latencies were similar for control (A1: slope = 0.08, R2 = 0.20) and foot-free RLMs (B1: slope = 0.09, R2 = 0.38). Relative onsets for SA were also similar. A2 and B2: LG onset strongly co-varied with cycle duration in both conditions (A2: slope = 0.63, R2 = 0.73; B2: slope = 0.89, R2 = 0.94). A3 and B3: Control FT burst onset (A3) displayed 2 regression trends (open circles: slope = 0.10, R2 = 0.30; closed circles: slope = 0.80, R2 = 0.93) that sorted by relative onset (open circles 0–0.5; closed circles 0.5–1.0). FT onset during foot-free RLM (B3) closely varied with cycle duration (slope = 0.86, R2 = 0.97), and exhibited a bias for late relative onset. C: SA, FT, and LG participation rates are shown for 9 foot-free experiments. The SA implant was lost in one experiment and the LG was in another.

