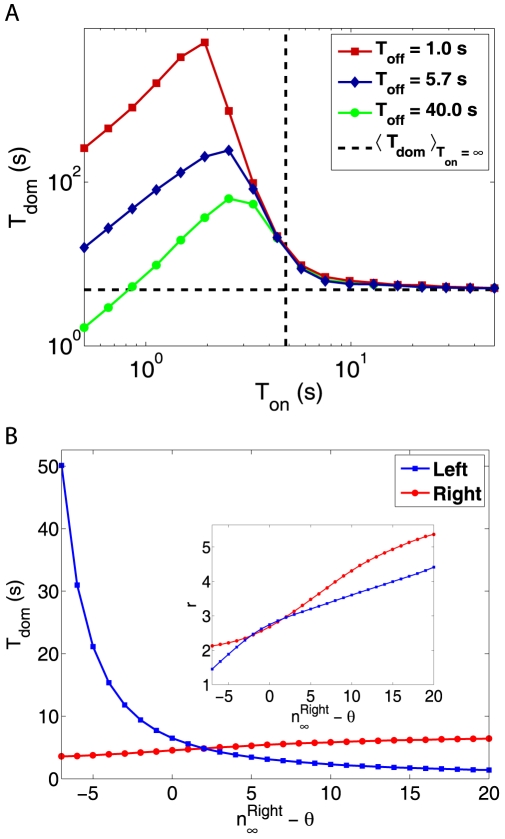
Figure 3. Mean dominance times under interrupted and continuous stimulation.
A: Mean dominance times  as a function of stimulus period
  , for different blank periods
  . B: Effect of differential stimulus intensity. Dominance times
  and
and  as a function of
  , when
  is held constant. The inset shows the corresponding shape parameters
  and
and  as a function of
  .
.

