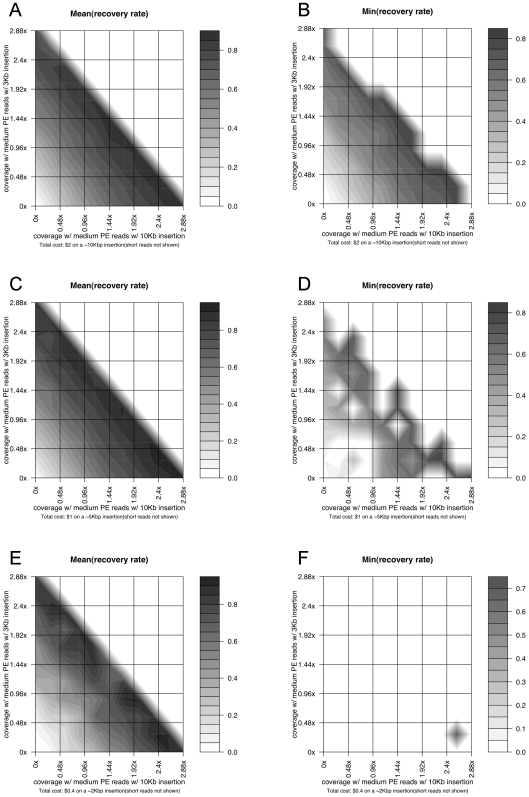
Figure 5. Simulation results on the reconstruction of large novel insertions using paired-end reads with different insert sizes.
(A) The same type of figure as Fig. 4A on a ∼10 Kbp novel insertion, with two axes representing the coverage of paired-end medium reads with ∼10 Kbp and ∼3 Kbp inserts. The coverage of paired-end short reads (with ∼150 bp insert) is not explicitly shown and changes with the values of the two other two, forming a same fixed total cost. (B) The same type of figure as Fig. 4B on a ∼10 Kbp novel insertion, showing the worst-case recovery rates on the insertion region with a fixed total sequencing cost. (C) The same type of figure as Fig. 4A on a ∼5 Kbp novel insertion. (D) The same type of figure as Fig. 4B on a ∼5 Kbp novel insertion. (E) The same type of figure as Fig. 4A on a ∼2 Kbp novel insertion. (F) The same type of figure as Fig. 4B on a ∼2 Kbp novel insertion.

