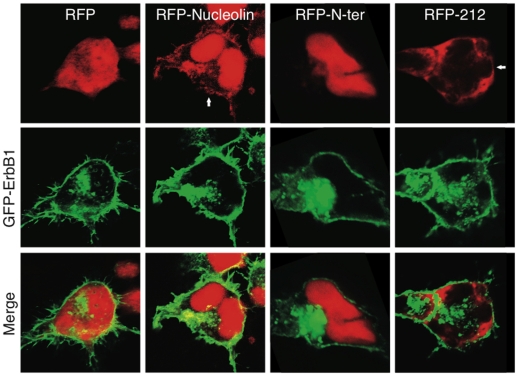
Figure 7. Cellular distribution of ErbB1 and nucleolin mutants.
HEK-293T cells were transfected with EGFP-ErbB1 and either pDsRed, pDsRed -nucleolin, pDsRed -N-ter or pDsRed -212-C-ter. 48 h following transfection cells were fixed and subjected to confocal microscopy analysis. GFP-ErbB1 is visualized in green and pDsRed expression vectors are seen in red. Representative cells are presented.

