
Figure 4.
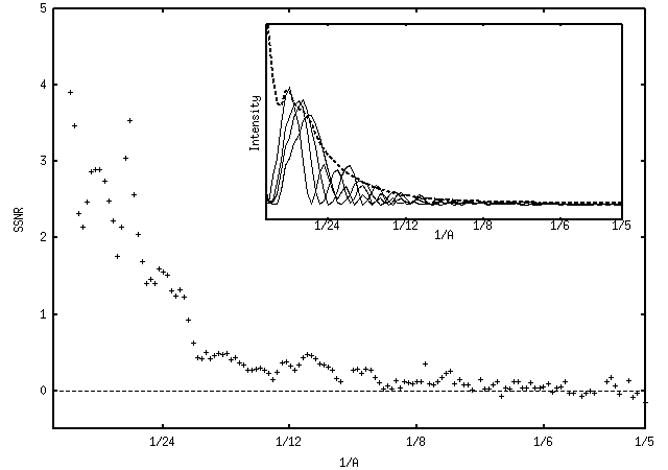
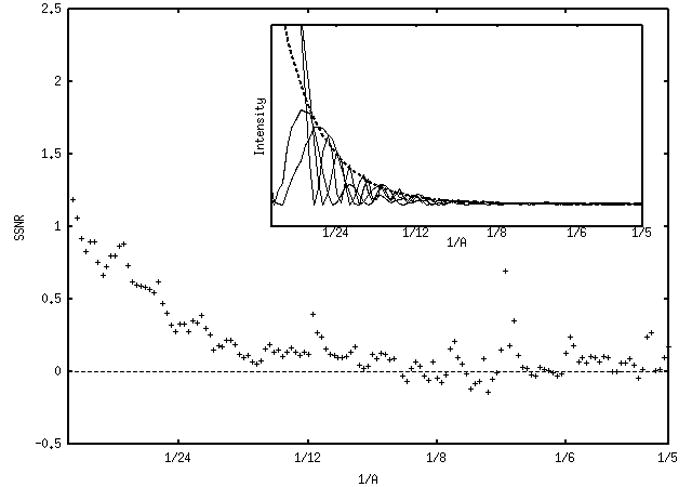
Average “true” structural SSNR of all four defocus groups (1μ, 2μ, 3μ, 4μ) for data set 1 (a) and set 2 (b). Note that the SSNR scale in (b) is expanded. Beyond 1/5 Å−1 the behavior of the data becomes very unstable. Insets in both panels show the power spectra of representative class averages for four defocus groups (solid lines), along with the averaged envelope function (dotted lines). The envelopes were determined either using SPIDER’s TF ED operation, or by fitting the maxima with an exponential function using gnuplot.