Fig. 1.
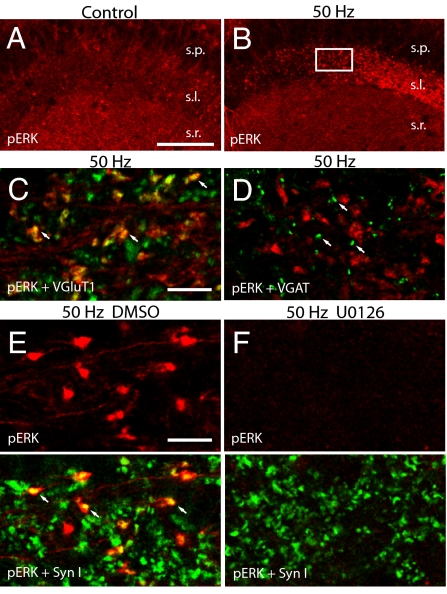
ERK activation occurs in excitatory giant terminals after tetanization of the CA3-MF pathway. (A and B) Confocal images show the distribution of immunolabeling for pERK in CA3 fields of a representative control slice that received baseline stimulation (A) and a potentiated slice (B) that was harvested 2 min after tetanization (1 × 50 Hz) of MF-CA3 synapses (s.l., stratum lucidum; s.r., stratum radiatum; s.p., stratum piramidale). (C and D) Representative confocal micrographs showing pERK-positive MF terminals in CA3 stratum lucidum after 50-Hz stimulation. pERK-IR (red) is clearly colocalized (arrows) with VGluT1 (green, C) but not with VGAT (green, D) immunosignal (arrows). (E and F) Confocal micrographs show double labeling for pERK (red) and Syn I (green) in CA3 stratum lucidum of representative tetanized (1 × 50 Hz) slices in the presence of either vehicle (E) or U0126 20 μM (F). Note the colabeled profiles representing ERK activation in Syn I-positive mossy fiber terminals (arrows in E) and the complete absence of pERK labeling after application of U0126 (F). White box in B indicates the location where images C–F were acquired. [Scale bars: 100 μm (A and B); 10 μm (C–F).]

