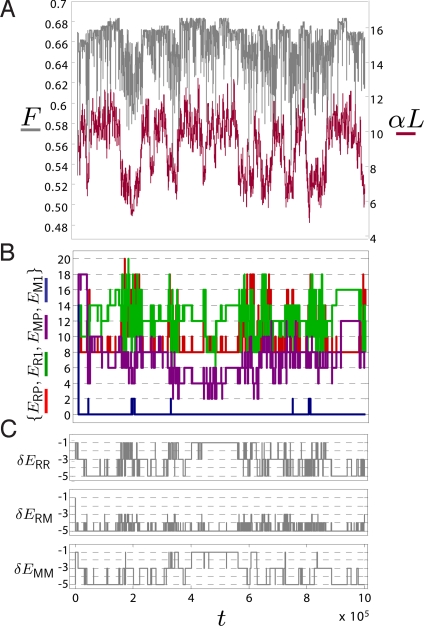
Fig. 3.
Time series data from a typical simulation run for a population size of N = 50 and a total of 107 attempted mutations (only first 106 steps shown for clarity) for evolution of solutions for the patterning problem. The parameter t represents the number of attempted mutations. Each mutation is separated by an average of 1/Nμ∣G∣ generations. (A) Fitness F versus time (gray) and steepness of morphogen gradient αL versus time (red). (B) Time series of binding energies Eij of ith protein to jth binding site of regulatory region of T. (C) Time series of glue energies δEii′, between the ith and i′th protein.

