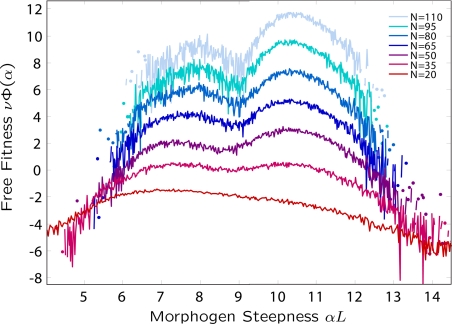
Fig. 4.
Free fitness landscape projected onto the morphogen steepness α as a function of populations size N, where each plot for a given value of N is offset vertically for clarity. Analogous to the free energy, local maxima in free fitness represent local equilibrium states; upon increasing the population size N, we see a change in the dominance of the low α-phenotype to the high α-phenotype.

