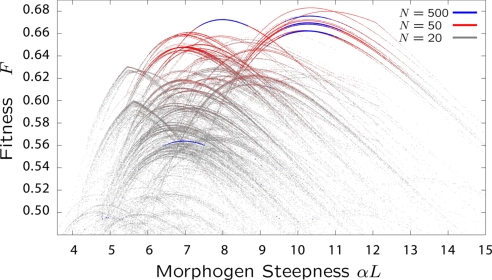
Fig. 5.
Fitness landscape projected onto the morphogen steepness α, for populations sizes N = 20 (gray), N = 50 (red), and N = 500 (blue). For N = 20, and N = 50, the plot is obtained from single simulations of 107 attempted mutations, whereas for N = 500, each isolated blue trace is from a single independent simulation, which total 6 in this plot. Each of the numerous single peaks represents a fitness landscape of the patterning problem for a fixed genotype but with α allowed to vary; vertical evolutionary transitions between curves arise from mutations in G, whereas evolution along each curve is due to mutations in α.

