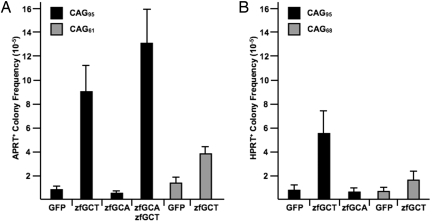
Fig. 4.
Induction of CAG repeat instability induced by ZFNs. The ZFNs were evaluated in (A) CHO cells and (B) human cells. The frequencies represent the averages of at least 6 independent experiments, with the exception of the zfGCA+GFP treatments for which there were at least 3 independent experiments. The standard deviations are indicated by the vertical bars. The values (×10−6) for each condition in CHO APRT(CAG)95 cells are: GFP (8.9 ± 2.6), zfGCT+GFP (90 ± 23), zfGCA+GFP (5.0 ± 1.6), and zfGCA+zfGCT (130 ± 31). For CHO APRT(CAG)61 cells, the values are: GFP (15 ± 5.7) and zfGCT+GFP (39 ± 6.6). For the human HPRT(CAG)95 cells, the value were: GFP (8.0 ± 4.5), zfGCT+GFP (55 ± 23), and zfGCA+GFP (4.6 ± 3.3). For the human HPRT(CAG)68 cells, the value are: GFP (8.0 ± 4.1) and zfGCT+GFP (17 ± 7.7).

