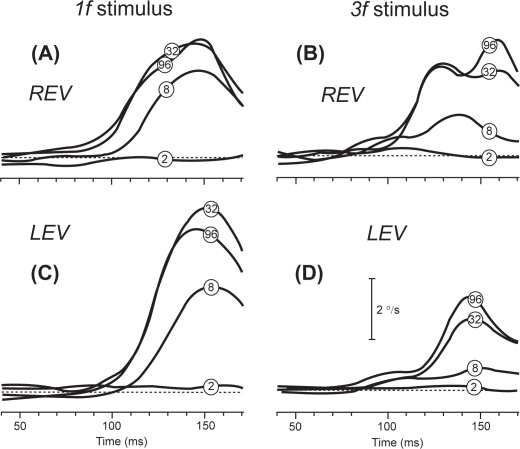
Figure 2.
Representative mean right-left velocity profiles of the ocular following responses (OFR) versus time elicited in a patient with MS who had partially recovered from a left optic neuritis. The patient responded to successive ¼-wavelength shifts applied to 1f stimuli (left column) and 3f stimuli (right column) of different contrast (contrast of the pattern is shown by encircled numbers superimposed on traces). A and B: right-eye-viewing sessions (REV). C and D: left-eye-viewing sessions (LEV). Note the smaller LEV responses to the 3f stimuli versus 1f stimuli. Adapted from (Rucker et al 2006).

