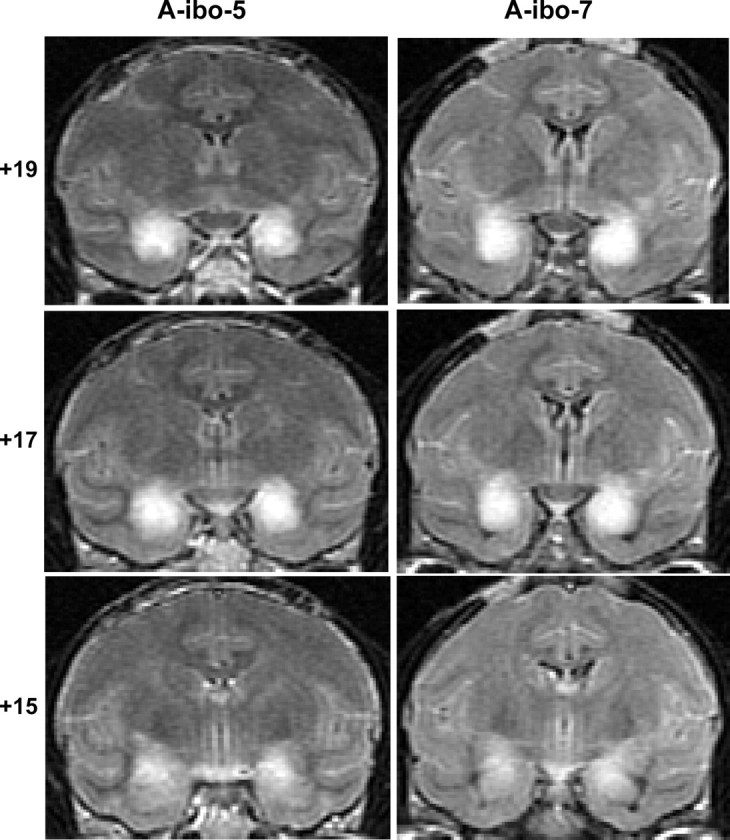
Figure 5.

Coronal MR images through three anterior–posterior levels of the amygdala in two representative cases (A-ibo-5 and A-ibo-7). FLAIR images show areas of hypersignals (white blobs) indicative of edema resulting from neurotoxin-induced cell death. The numerals on the left indicate the distance in millimeters from the interaural plane.
