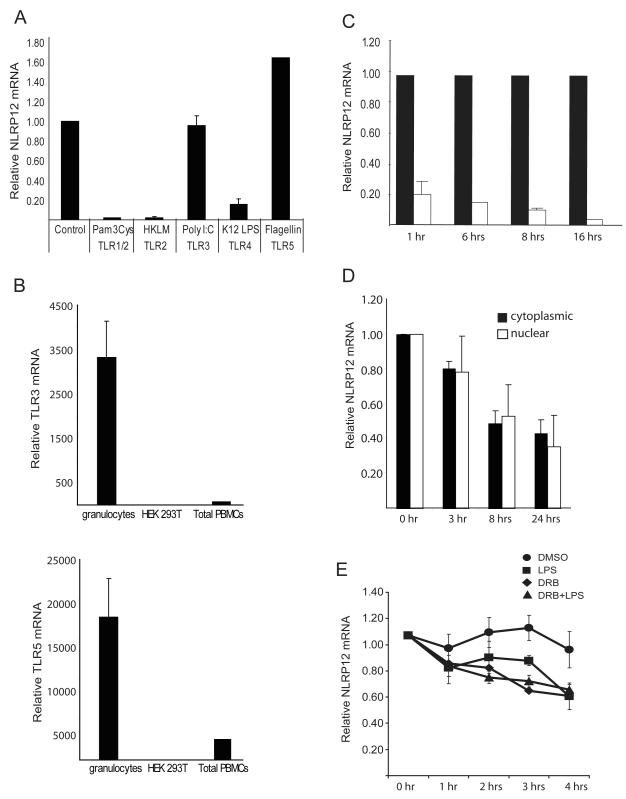
FIGURE 1.
NLRP12 expression is regulated by specific TLRs. (A) Human primary granulocytes were stimulated with the indicated TLR agonists for 1 hour. NLRP12 expression was analyzed by qPCR analysis of total RNA. NLRP12 expression was normalized to the housekeeping gene β-glucuronidase (GusB). Data are an average of three separate experiments. (B) TLR3 and TLR5 expression in total human peripheral blood cells, granulocyte isolated from human peripheral blood cells by ficoll separation, and in the HEK293T cell line were assessed by qPCR. TLR expression was normalized to the expression of GusB. (C) NLRP12 expression in human adherent peripheral blood cells stimulated for 1, 6, 8 and 16 hours with phenol-purified LPS (TLR4 agonist). NLRP12 expression was normalized to the expression of 18S rRNA and represented as fold difference compared to control. Error bars represent the SEM of three separate cell preparations and experiments. (D) The reduction of nuclear verses cytoplasmic NLRP12 expression after TLR activation. U937 cells were stimulated with 500 ng/ml LPS for 3, 5, 8, 18 and 24 hours followed by isolation of nuclear verses cytoplasmic mRNA as described in materials and methods. NLRP12 mRNA abundance was then quantified by qPCR and normalized to GusB. (E) The stability of the NLRP12 mRNA is similar in cells treated with a transcriptional inhibitor or stimulated with LPS. The human pre-monocyte cell line HL-60 was treated with 1.25% DMSO for 3 days to induce differentiation into NLRP12 expressing neutrophils. Differentiated HL-60 cells were then stimulated with LPS (squares), treated with DRB (triangles), treated with DRB plus stimulated with LPS, or exposed to 0.1% DMSO (circles) as a vehicle control for 0, 1, 2, 3, and 4 hours. NLRP12 mRNA abundance was then quantified by qPCR. The amount of NLRP12 mRNA at the time before DRB addition (0 hr) was set to 1, and the amount remaining at the indicated time points was determined. Error bars represent the SEM of five separate experiments.

