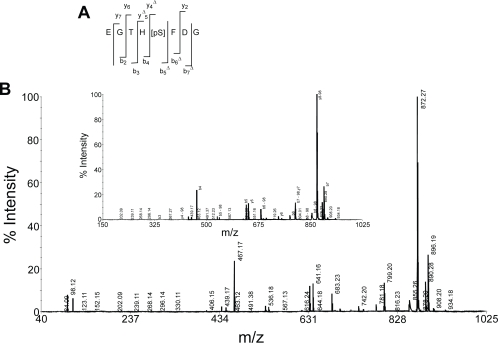
Figure 4.
The CID mass spectrum of the phosphopeptide E8Gp recorded on 4800 MALDI TOF TOF mass analyzer. Panel A shows the fragmentation pattern of the peptide. Δ indicates the corresponding bn or yn ion minus H3PO4. Panel B shows the MS/MS spectrum of E8Gp. Number next to bn or yn ion indicates loss of H3PO4 .The inset shows expanded region of the spectrum showing b-type and y-type ions.

