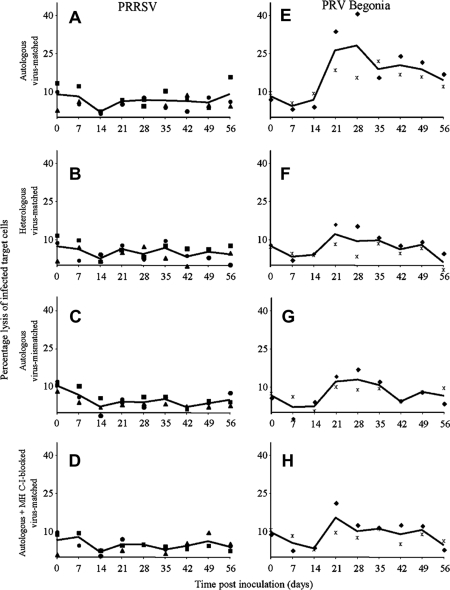
Figure 4.
Time course of cytolytic activity of virus-restimulated PBMC (derived from virus-infected pigs) towards autologous virus-infected macrophages (A, E), towards heterologous virus-infected macrophages (B, F), towards autologous macrophages that were infected with another virus (C, G) or towards autologous virus-infected macrophages, that were incubated with anti-MHC-I antibodies (D, H). A, B, C and D show data for PRRSV-infected pigs; E, F, G and H show data for PRV Begonia-infected pigs. Full symbols represent individual pig values (■ pig 1, ● pig 2, ▲ pig 3, ♦ pig 4,  pig 5). Each symbol represents the mean of 3 repetitions in an individual pig. Full lines represent average values of the pigs.

