Figure 1.
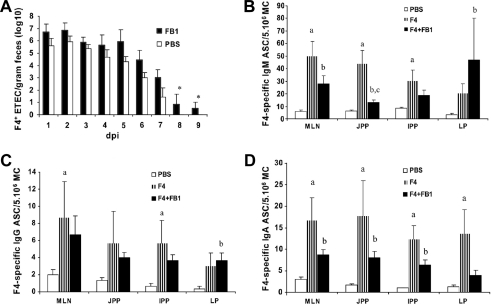
(A) Mean fecal F4+ E. coli (log 10) per gram feces (± SEM) following F4+ ETEC infection of FB1-exposed (FB1, n = 5) and non-exposed animals (PBS, n = 5) at 1 to 9 days post infection (dpi). The asterisk indicates a significant difference (p < 0.05) between both groups. (B) Mean F4-specific IgM, (C) IgG and (D) IgA ASCs (± SEM) per 5 × 10⁶ MC in lamina propria (LP), mesenteric lymph nodes (MLN), jejunal (JPP) and ileal Peyer’s patches (IPP) of control animals (PBS, n = 3), F4-immunized animals (F4, n = 3) and FB1-exposed and F4-immunized animals (F4+FB1, n = 3) at one week following immunization. Different letters indicate a significant difference (p < 0.05) between groups: (a) PBS-F4, (b) PBS-F4+FB1, (c) F4-F4+FB1.

