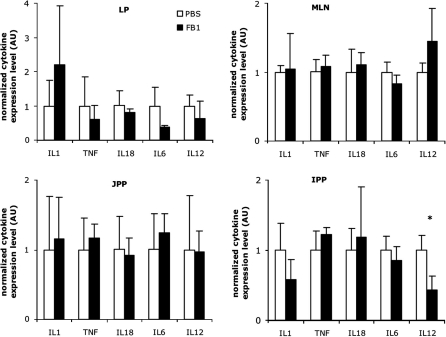
Figure 2.
The mean fold change of expressed cytokines to a combination of the housekeeping genes cyclophilin A, β2-microglobulin and β-actin (± SD) in the lamina propria (LP), mesenteric lymph nodes (MLN), jejunal (JPP) and ileal Peyer’s patches (IPP) of non-exposed animals (PBS, n = 3) or FB1-exposed animals (FB1, n = 3) at the end of the FB1 administration period. The cytokine expression level is represented in fold change compared to the PBS group (mean value of 1). The asterisk indicates a significant difference (p < 0.05) between both groups.

