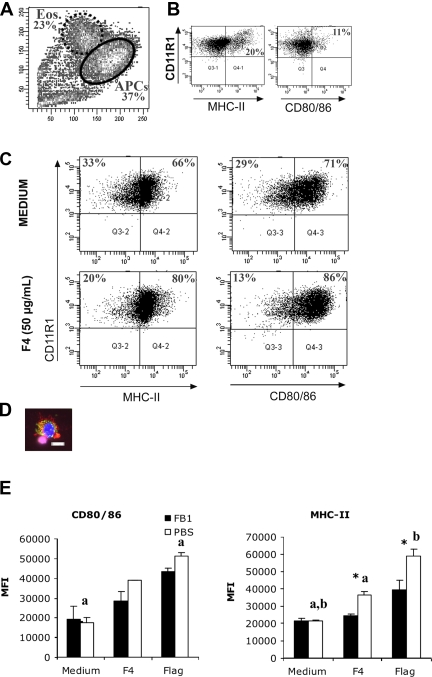
Figure 3.
Increased expression of APC maturation markers MHC-II and CD80/86 on CD11R1+ LP APC in response to stimulation with 50 μg F4. (A) Forward and side scatter characteristics of enriched CD11R1+ cells, consisting of APC and contaminating eosinophils. (B) Eosinophils do not express APC maturation markers. (C) Purified CD11R1+ cells, gated on the APC population. One representative experiment out of 3 independent experiments is shown. (D) An isolated LP APC stained with anti-CD11R1 TexasRed, anti-MHC-II FITC and DAPI, bar = 10 μm (E) Mean fluorescence intensity (MFI (± SD)) of isolated CD11R1+ LP cells stained for CD80/86 and MHC-II expression and gated on the APC population from non-exposed (PBS, n = 3) or FB1-exposed animals (FB1, n = 3) following overnight stimulation with 50 μg F4 (F4) or flagellin (Flag). The asterisk indicates a significant difference (p < 0.05) between both groups; the letters indicate a significant difference between unstimulated (medium) and stimulated cells within groups.

