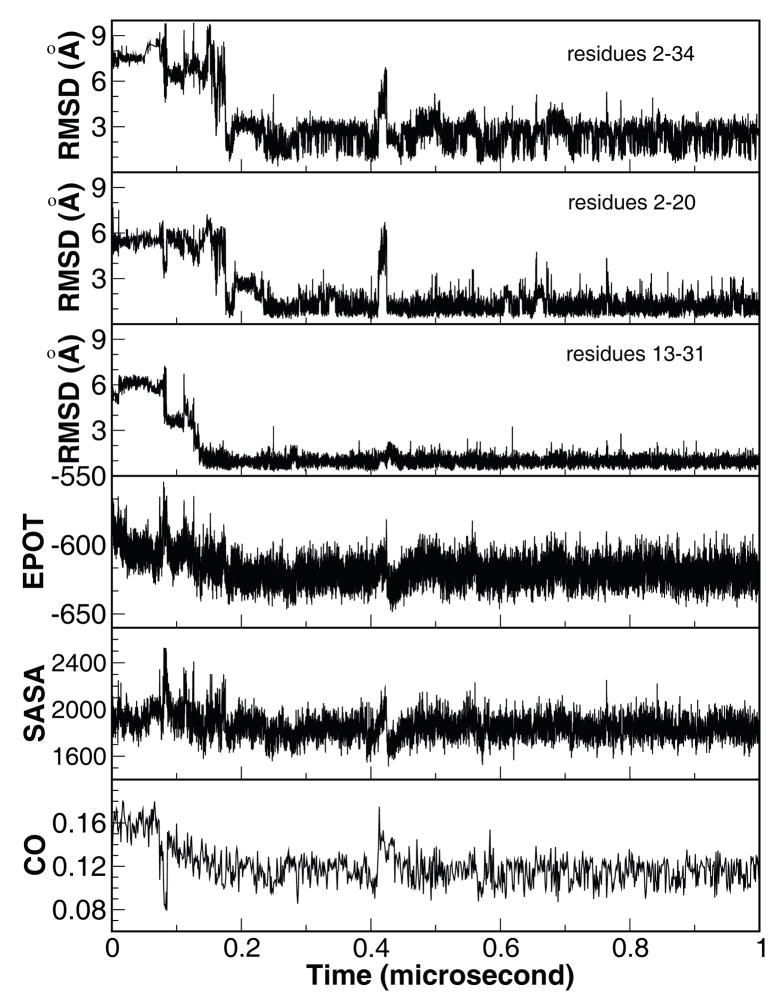
Figure 1.
Time history of structural properties of a representative folding trajectory. From top to bottom, Cα-RMSD of the whole protein relative to the X-ray structure (PDB code 1YRF) and the two structural segments, segment A encompassing helices I and II (residues 2–20), and segment B encompassing helices II and III (residues 13–31), potential energy (kcal/mol), solvent accessible surface area (Å2), and contact order. The X-ray structure of HP35 was used as reference for RMSD calculations.

