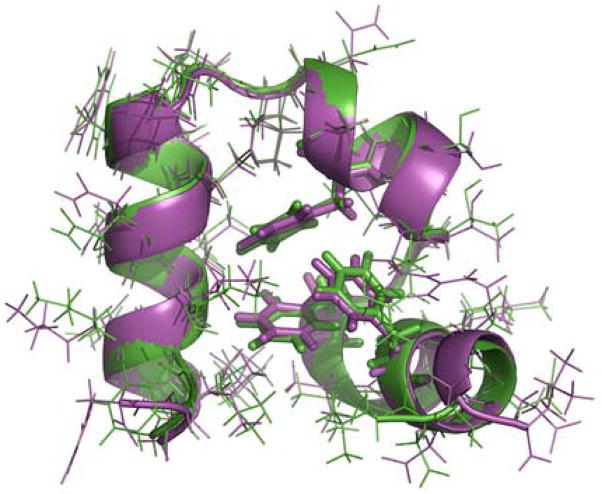
Figure 4.
Superposition of the best folded structure in the simulation (magenta) and the X-ray structure (PDB code 1YRF, green). Backbones are represented as ribbons. The three core phenylalanine residues (F6, F10 and F17) are shown as sticks. The Cα-RMSD is 0.39 Å. The all-atom RMSD is 1.25 Å. One residue of each of the terminii was excluded in the RMSD calculations due to the general nature of elevated dynamics.

