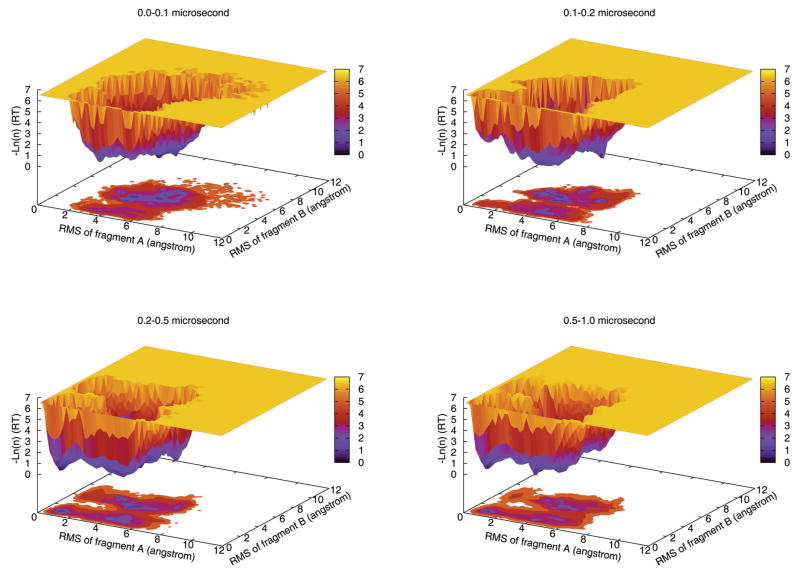
Figure 7.
Population shift during the simulations. The distribution histograms are in natural log scales for the time frames of 0–0.1 μs, 0.1–0.2 μs, 0.2–0.5 μs, and 0.5–1.0 μs. The Cα-RMSD of the two segments A (residues 2–20) and B (residues 13–31) are used as reaction coordinates. As simulation progressed, the population shifted to semi-folded and folded states and the overall conformational space also shrunk.

